
A snapshot of my contributions
Discovery: Customer interviews, delegating work to research teams
Collaboration: Working with research & product to gather customer insights
Design: Prototyping Figma designs & working with devs on an MVP
Feedback: Creating task scripts, running tests, incorporating feedback
Timeframe: 4-6 months
Empathize: What is the problem?
Trucking fleets need solutions that help improve uptime, increase efficiency and reduce costs. Aptiv Connect Pro not only provides rich, high-fidelity data, but also translates that data into valuable fleet insights. And it integrates with the fleet telematics solutions that fleet managers are already using.

Define: Deeply understanding the problem.
In early 2023, I met with actual fleet managers who would be potential customers for our fleet insights offering and found out what their data-collection needs were. I led the design & research teams in conducting interviews with them and found out what insights would be the most helpful to them in a fleet analytics dashboard.
Ideate: How can we solve the problem?
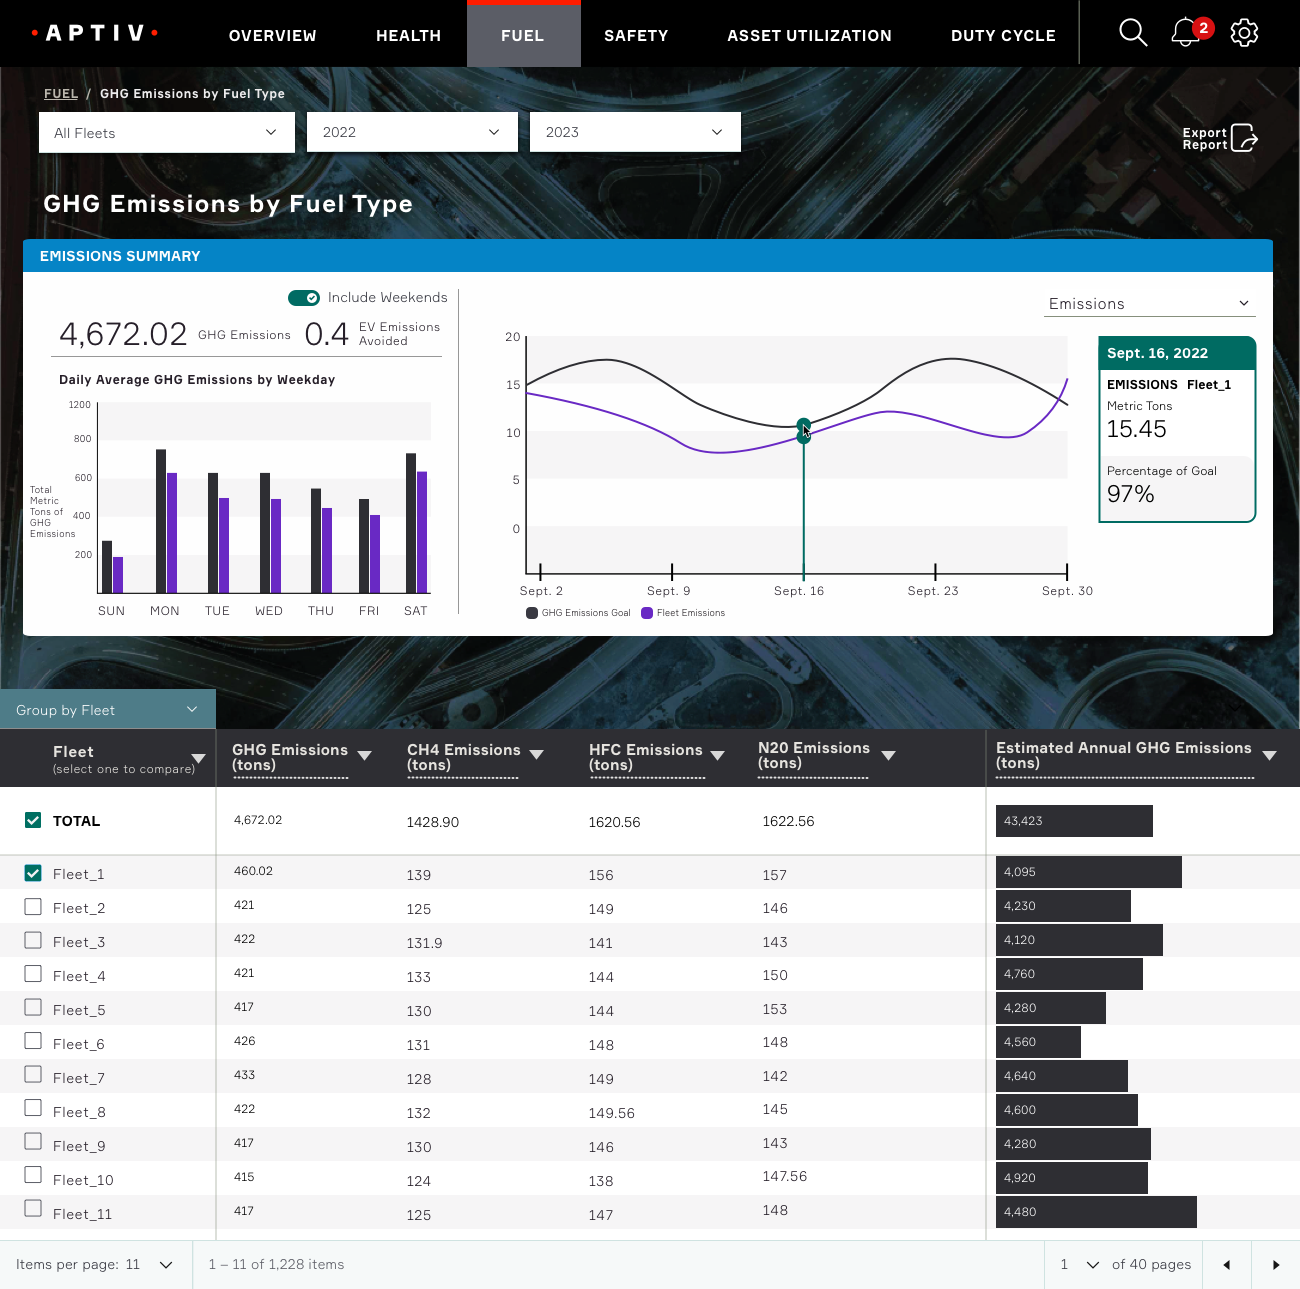
Throughout the summer of 2023, I worked to address the highlighted needs from those interviews as well as new needs (mainly the addition of a regulated emissions-reporting need in the trucking industry).
Prototype: Show an MVP that can solve the problem.
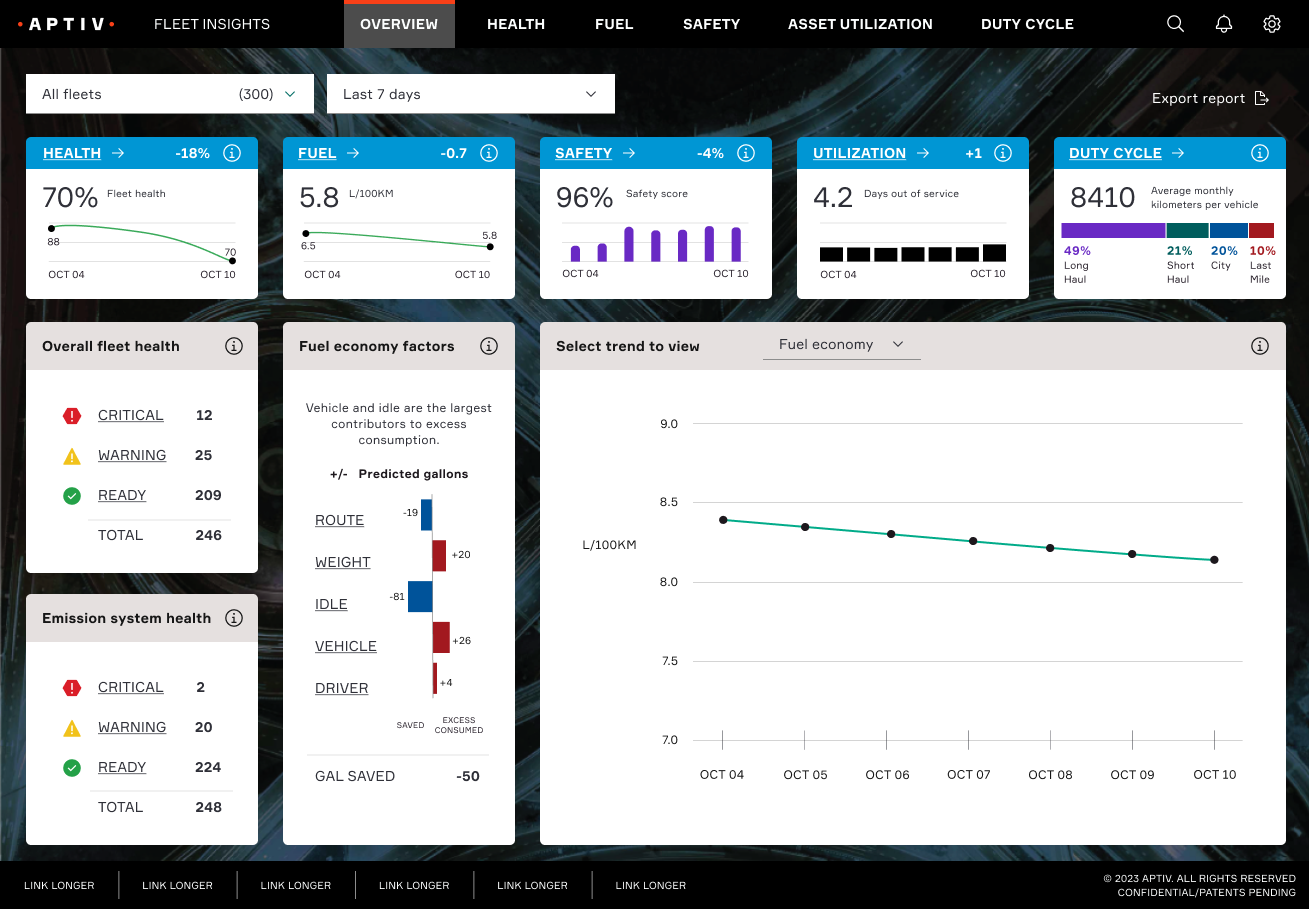
Under my leadership, our team created a working analytics MVP in the fall of 2023.
Test: Do real users feel like this would solve the problem?
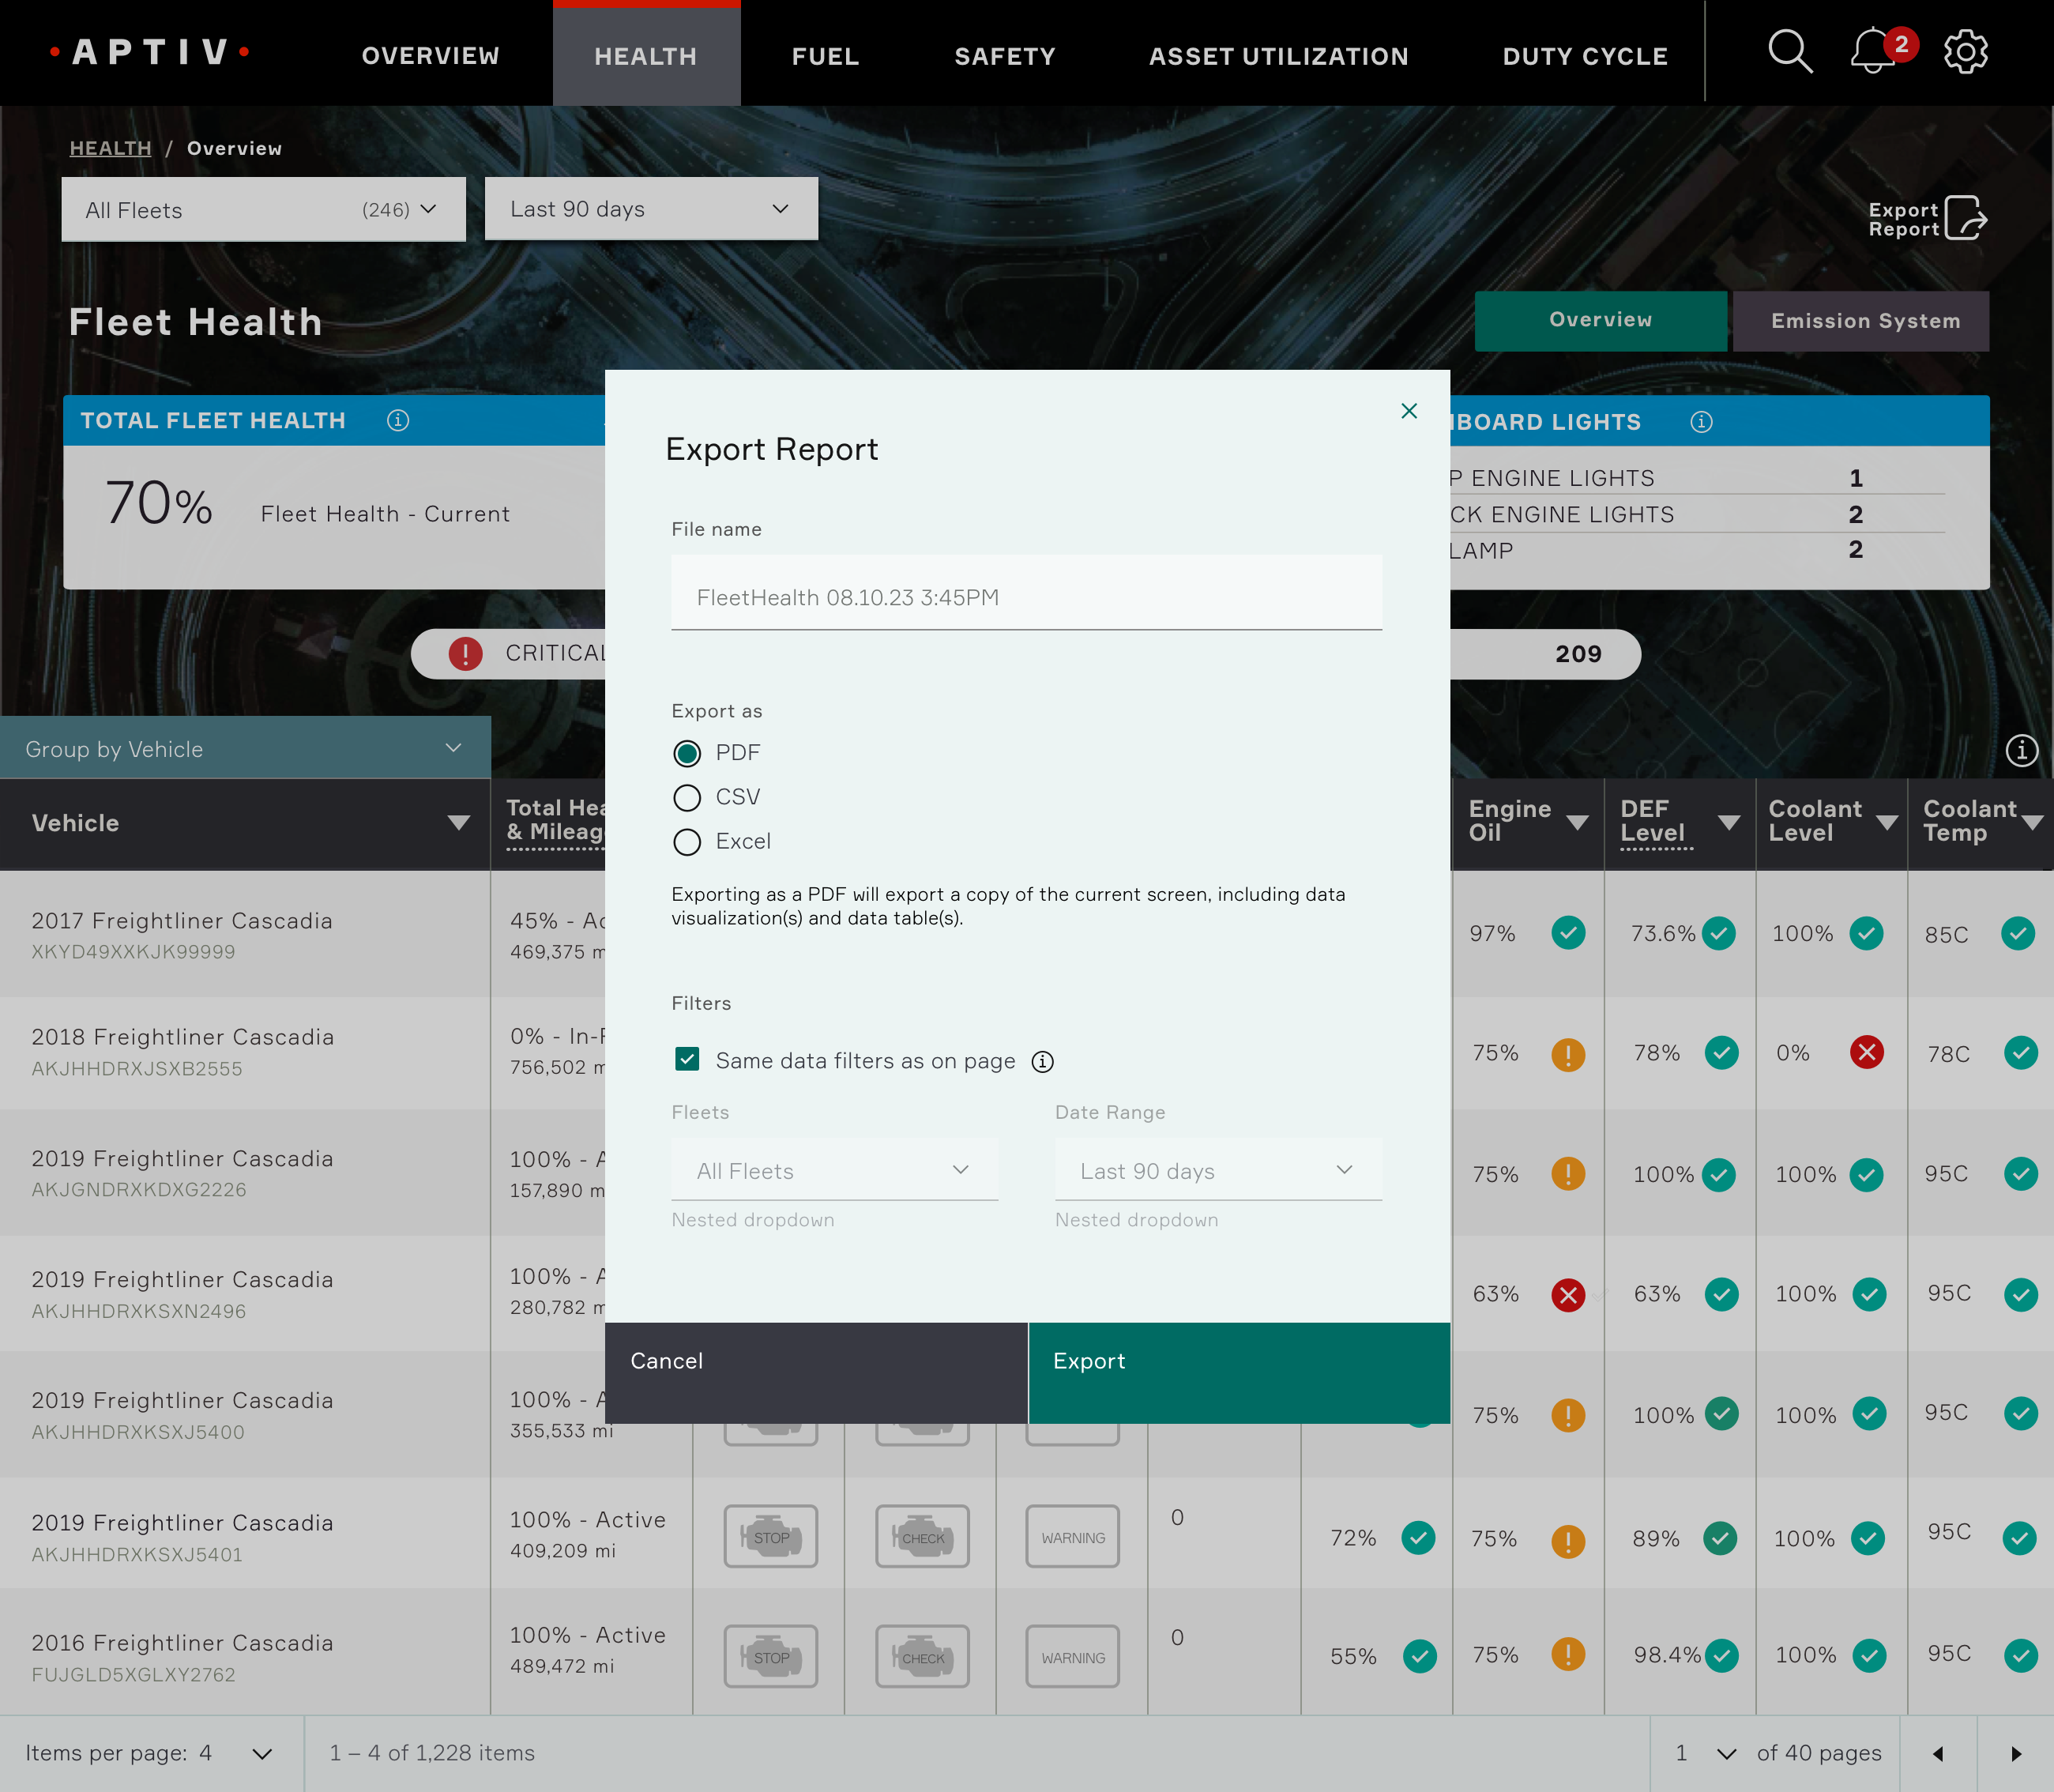
User interviews were completed in early 2024 where I created scripts asking them to complete workflow tasks and provide feedback on the dashboard product. This feedback was incorporated back into prototype updates.
Outcome:
The project rolled out to already-signed paying customers in 2024, onboarding existing customers through the end of the year and continued to onboard new customers in 2025. Projected revenue by EOY 2026 is $150M for Fleet Insights.
You can view more about it here on Aptiv’s site.
Extras:
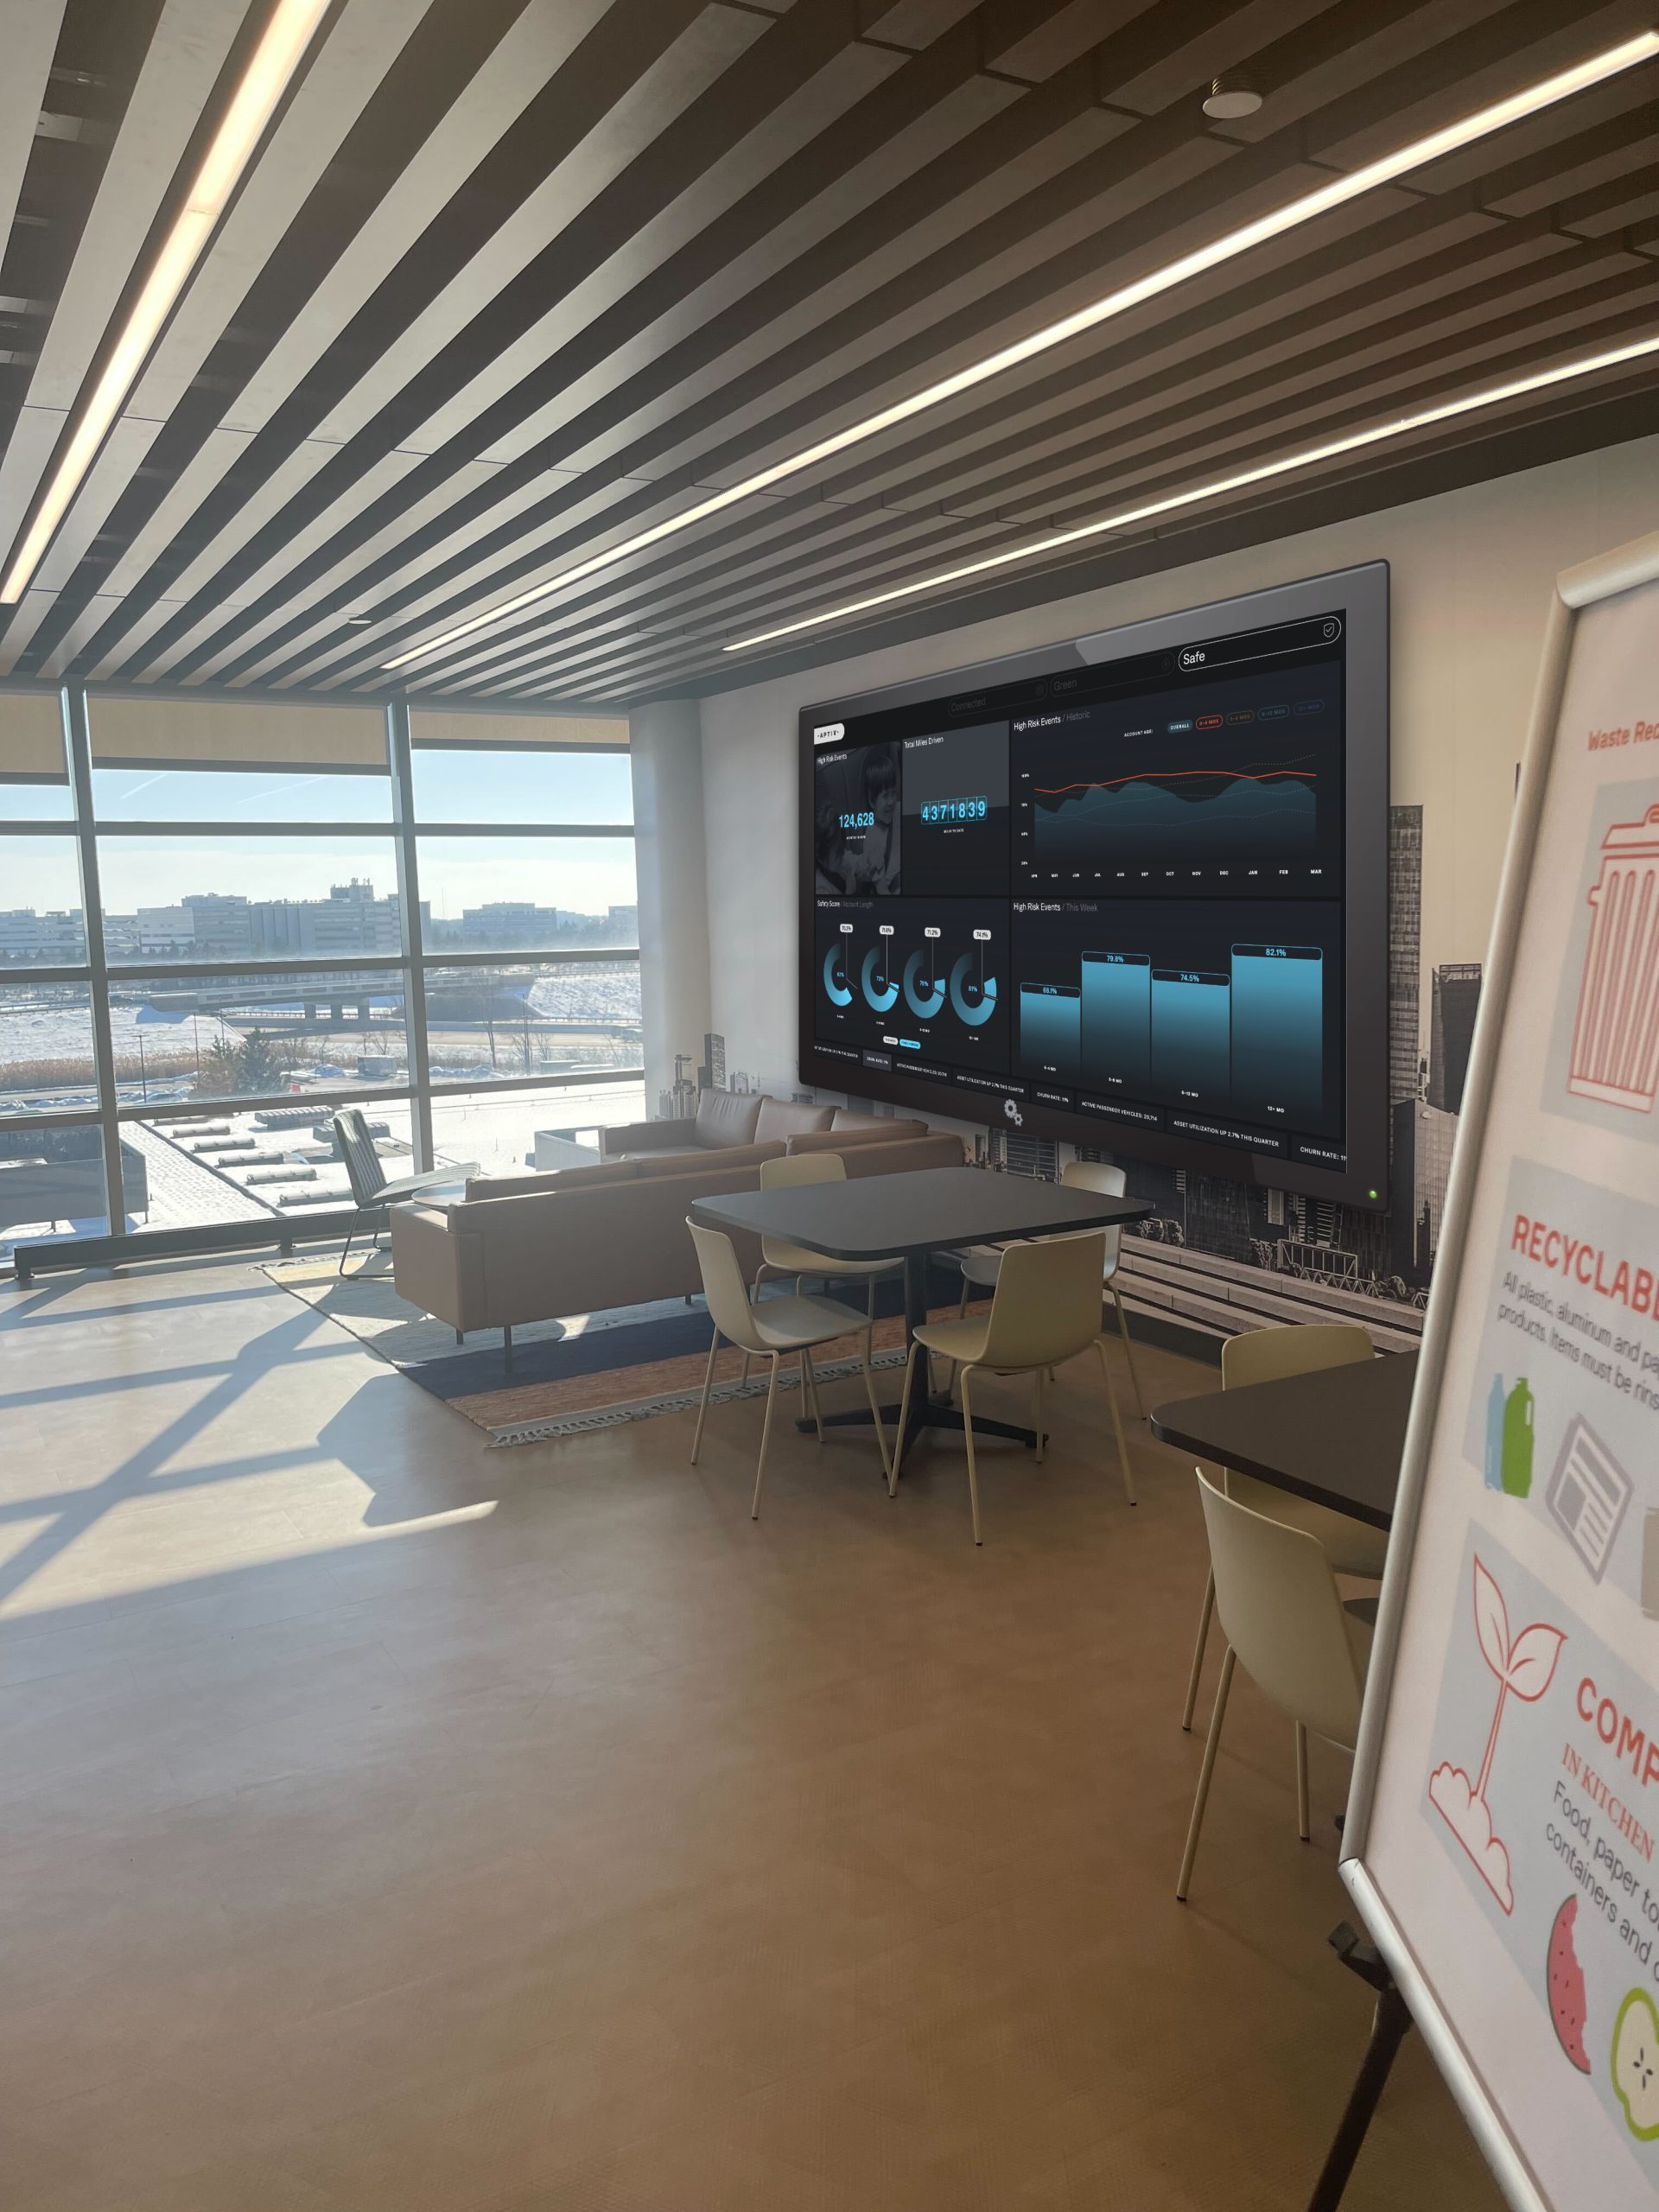
Below are concepts for installing displays in Aptiv’s headquarters in Michigan to show the analytics being collected live on the Edge platform:
Tools used:

![]()
![]()